DPlot 2.3.4.4 Eng
 DPlot - программа для построения графиков, созданная для ученых, инженеров и студентов. Важной составной частью программы является наличие нескольких типов масштабирования, включая линейный, логарифмический и вероятностное масштабирование, а также несколько специальных графиков. В функции манипуляции входит FFT, фильтрация и сглаживание. Данные могут быть введены через файл, скопированы из буфера обмена, отправлены в DPlot из Excel с помощью Add-In или через динамичный обмен данными.
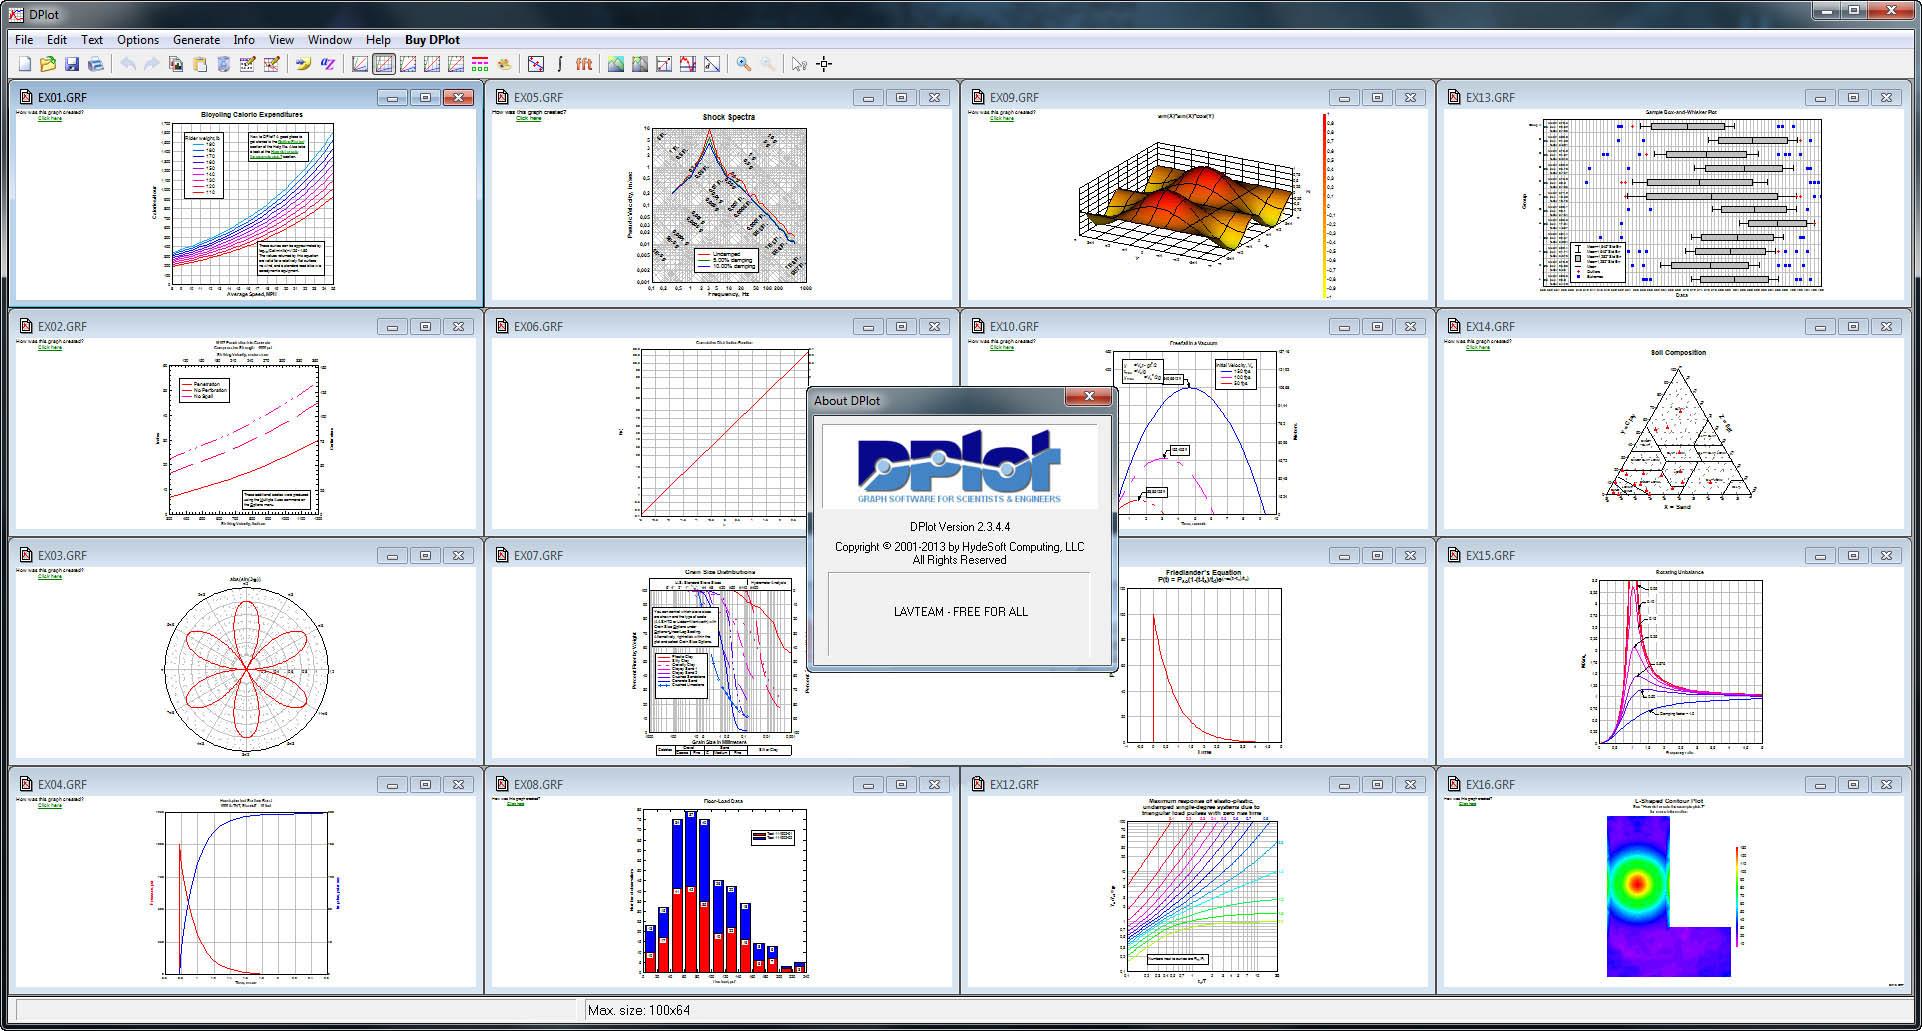
Key Features:
• Multiple scaling types, including linear, logarithmic, and probability scales on the X and/or Y axes. DPlot also provides several special purpose scale types, including grain size distribution plots, tripartite grids (shock spectra), polar charts, and triangle plots.
• Bar charts with bars drawn side-by-side or stacked.
• Box-and-whisker plots and dot graphs for one or more groups of 1D data.
• Multiple independent or dependent scales.
• Error bars with magnitudes set to a constant value, to a percentage of the amplitudes, or independently.
• Fill between 2 curves, fill the area formed by closing a curve, or fill from a curve to a specified Y value. Choose from seven pre-defined fill patterns or create a custom pattern.
• Contour plots of 3D data, shown as contour lines in a plan view of the XY plane or as shaded bands in a 3D projection. DPlot accepts both randomly-spaced 3D points and points on a rectangular grid. For rectangular grids only, DPlot can also produce a waterfall plot.
• 3D scatter plots, with up to 100 data sets and colors based on Z value or data set.
• Choose from 38 symbol styles and/or 7 line styles for your XY plots. You have full control over symbol size, line weight, and color.
• Choose from a variety of number formats for each axis. Date and time formats are customizable.
• Copy and/or link data from other sources (e.g. spreadsheets), or use our Excel Add-In to easily move data from Excel to DPlot.
• Copy and/or link DPlot-produced graphics to other applications.
• Add text notations to plots.
• Generate curves from formulas.
• Data manipulation functions include integration, differentiation, Fast Fourier Transform, filtering, data smoothing, and many other simpler editing functions.
• If you have several data records from the same high-speed event and want to play back those records in sync with each other... well, you can. Have a video associated with your data? Play the video back along with your data, synchronized at the data rate you specify.
• Interpolate between points, scan values of curves graphically, and report peak values.
• Include subscripts, superscripts, and characters from the Symbol font (Greek characters, trademark symbols, etc.) in the title lines and axis labels of your plots, as shown here.
• Plot very large data sets. The number of data points is limited only by the memory (both physical and virtual) on your system.
• Send data to and control DPlot from another program through the DPLOTLIB interface (available free-of-charge as a separate download. Example programs with source for Visual Basic, VB.NET, PowerBasic, 4 different C compilers and 5 different FORTRAN compilers are provided.
• You may create additional functionality with your own plugin modules for file import and data manipulation. Example C plugin source code is provided with the Plugin Examples.
Страничка: www.dplot.com
Интерфейс: английский
Система: Windows all